Edit : April 2025 : If you are looking for the latest edition of EV Charging Infrastructure Reports, then please follow these links :
2503 EV charging infrastructure
This is the sixth edition of the report on the state of Indian EV Charging infrastructure. This report contains 26 charts depicting trends across the industry over two years, CCS2 and Type2 connectors, leading charge point operators in each zone, non working connectors, infrastructure in major metro cities across the country.
Here are some of the older reports :
September 2022, February 2023, September 2023, February 2024, September 2024
And now, December 2024.
P.S. : The disclaimer about each report is mentioned in the above link.
We are currently covering public connectors from the following CPOs - Aargo, Adani Total Gas, Audi/ChargeZone, Bijlify, BPCL, chargeMod, ChargeZone, eFill, emobility, EV Pump, EV Dock, EVOK/chargeMod, Evolute Surat, Gentari/ChargeZone, Glida, GMVN/Statiq, GOEC, GoEgo, HPCL, Hyundai/ChargeZone, Hyundai/Statiq, IOCL, Jio BP, KSEB/chargeMod, Kurrent, LionCharge, Mercedes/ChargeZone, Mobilane, NikolEV, Recharge EV, Relux Electric, Shell Recharge, Statiq, SunFuel, Tata PEZC, Volt Panda, Voltran, Volttic, Xobolt and Zeon.
Please go through the data disclaimers and disclosures section at the end of this post.
Last week, we released an update to EVInfraBI, which looks at the granular charging infrastructure in great detail. EVInfraBI lets you look at individual charging locations and their geographical properties. It is a great tool to go in-depth and understand how these CPOs are expanding their network across India. Here’s the blog post talking about it.
Today, we look at the charging infrastructure from a high level overview. We look at the trends and growth of the charging infrastructure in India, across the CPOs and states.
All the data will reside on EVTrendsBI - an interactive Business Intelligence tool built by Garvit and me. This is extremely lightweight and is hosted on PowerBI. It contains data from the previous charging infrastructure reports till date. This interactive tool will allow you to view the historic trends of growth of charging infrastructure as well as who stands where today. There’s a lot of analysis that can be done with simple charts, such as comparing the growth of different CPOs over time, identifying regional trends in infrastructure expansion, and pinpointing CPOs and states with high concentrations of non working connectors. This is our attempt to showcase it.
You can get your hands on it today by going to the last section of the article. There’s more than 25% discount for early buyers and special perks for premium subscribers!
Let’s take a look at the charts from EVTrendsBI here.
Appeal
It takes a lot of hard work to prepare this kind of report. If you believe that the data and analysis has provided value to you, then please consider getting a premium subscription to this blog. Premium subscribers to this blog can get detailed EVTrendsBI at a discounted price!
Let’s dig in
We finally broke the 10,000 total charging connectors installed in India. Big congratulations to everyone. This is a huge moment for the industry, and we are on track to surpass 100,000 connectors in the next few years. This is an exciting time for the EV sector!
CCS2 Infra
Pan India
Maharashtra has always led the pack, and it still does as of December 2024 with 1,986 CCS2 connectors. The next three states are Gujarat at 1,119, Karnataka at 1,086, and Tamil Nadu at 885.
Here is the comparison over the years for CCS2 infrastructure.
The top six places are taken up by three Western states and three Southern states. Haryana is the seventh state, representing first North Zone state.
Interactive running chart for Figure 4 is here. (You really want to check this link out).
Tata PEZC finally has a competitor in IOCL for CCS2 connectors. For the first time in a long while, we see a strong challenge to Tata PEZC’s dominance in this segment.
However, the story doesn’t end here. There’s much more to uncover.
Zonal Distribution
The West Zone leads in the number of installed CCS2 connectors, with 150 more connectors than the South Zone. The North Zone had been keeping pace with the West and South Zones throughout 2022 and 2023, but by the end of 2024, growth in the North Zone has slowed significantly.
The Central, East, and North East Zones are showing signs of growth. By December 2024, the Central and East Zones have slightly surpassed the levels of the West and South Zones from September 2022, indicating a lag of over two years.
In September 2023 and February 2024, the Central and East zones were lagging by more than a year and eighteen months, respectively. However, by December 2024, it is clearer that the lag has reduced to just under two years.
The slicers in the chart allow you to filter the data by CPOs, States, Connector Type, Zones, and Report Version. This feature is available exclusively to EVTrendsBI buyers.
Pan India
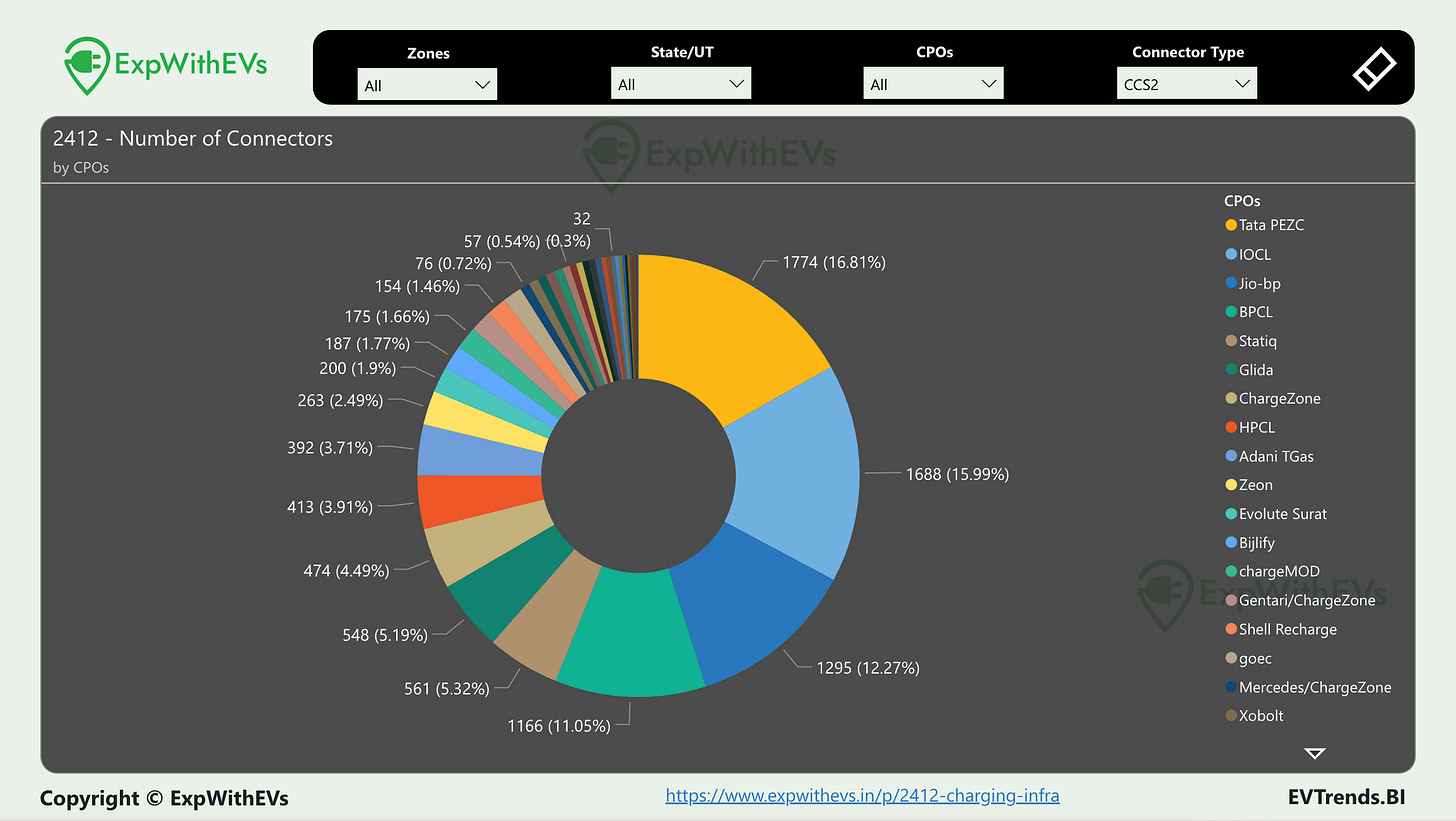
The top four players account for more than half of the country's CCS2 connectors. Among them, two belong to major conglomerates: Tata PEZC (1st) and Jio-bp (3rd). The other two are government-owned entities: IOCL (2nd) and BPCL (4th). The fifth player, Statiq, has less than half the number of CCS2 charging points as BPCL.
The top four players have access to significantly more capital than upstarts like Statiq, Glida, ChargeZone, and Zeon. Additionally, HPCL and Adani TGas, ranked eighth and ninth, also have substantial capital backing. Although slightly late to the market, these companies are poised to rapidly expand their infrastructure.
Now, let's examine each zone independently to identify the key contributors.
West Zone
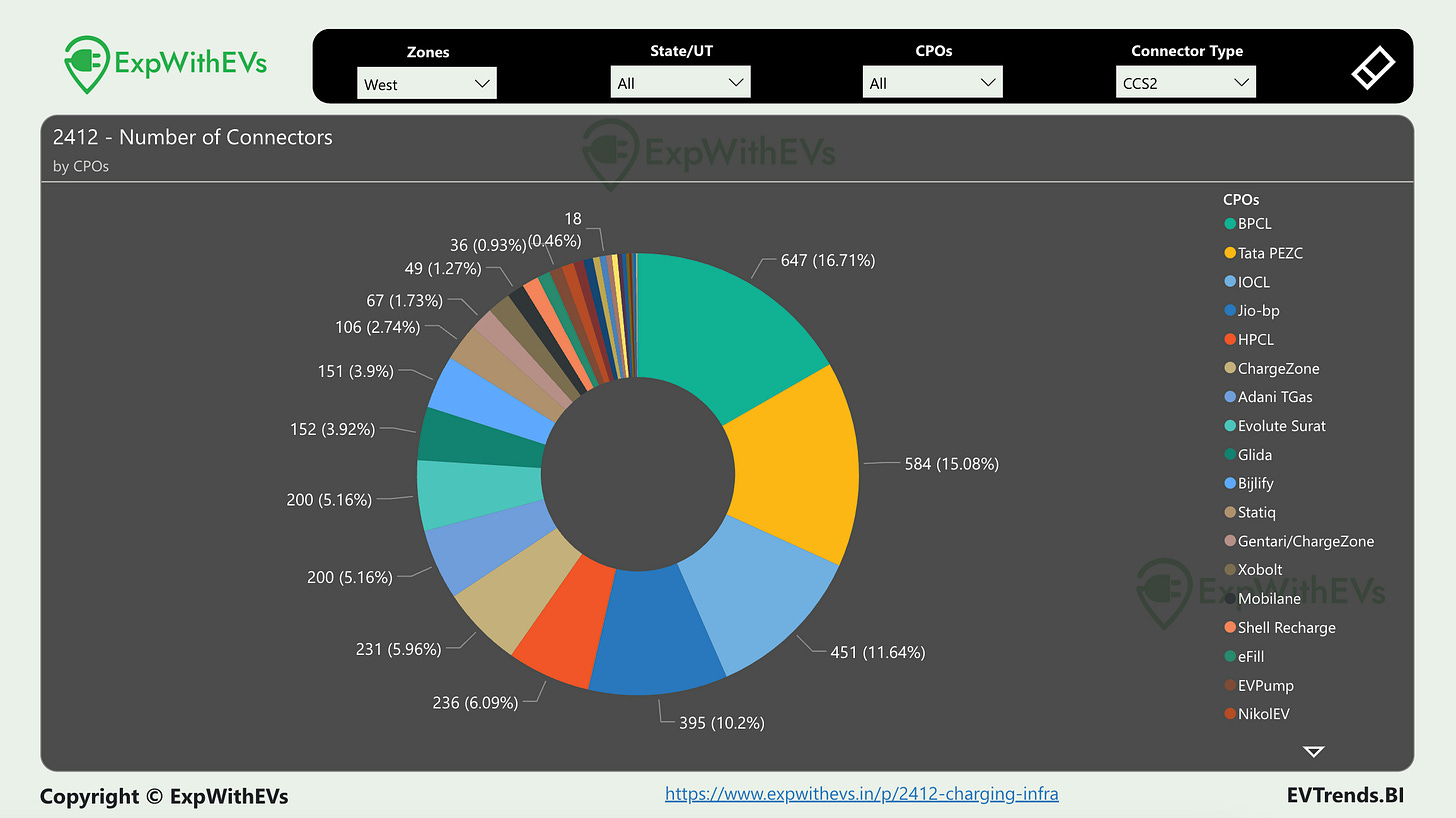
BPCL has overtaken Tata PEZC and is now the leading CPO for CCS2 charging points in the West Zone. The top four players collectively hold just over half of the CCS2 charging connectors in the region. Three of these top four players, BPCL, IOCL, Jio-bp, are Oil Marketing Companies, with the fifth player, HPCL, also being an Oil Marketing Company.
South Zone
IOCL (1st), Tata PEZC (2nd), and Jio-bp (3rd) together account for nearly half of the CCS2 charging points in the South Zone. The fourth position is a close race between Glida and Zeon, with Glida leading by a small margin. Jio-bp has nearly twice as many charging points as Zeon or Glida, while market leader IOCL has more than three times the number of charging points.
North Zone
Tata PEZC has managed to maintain its lead in the North Zone, accounting for 17.5% of CCS2 charging points, closely followed by Jio-bp with 16.51%. Statiq is also emerging as a strong contender with 14.54% of CCS2 charging points. The competition between these players remains intense.
Metro Cities
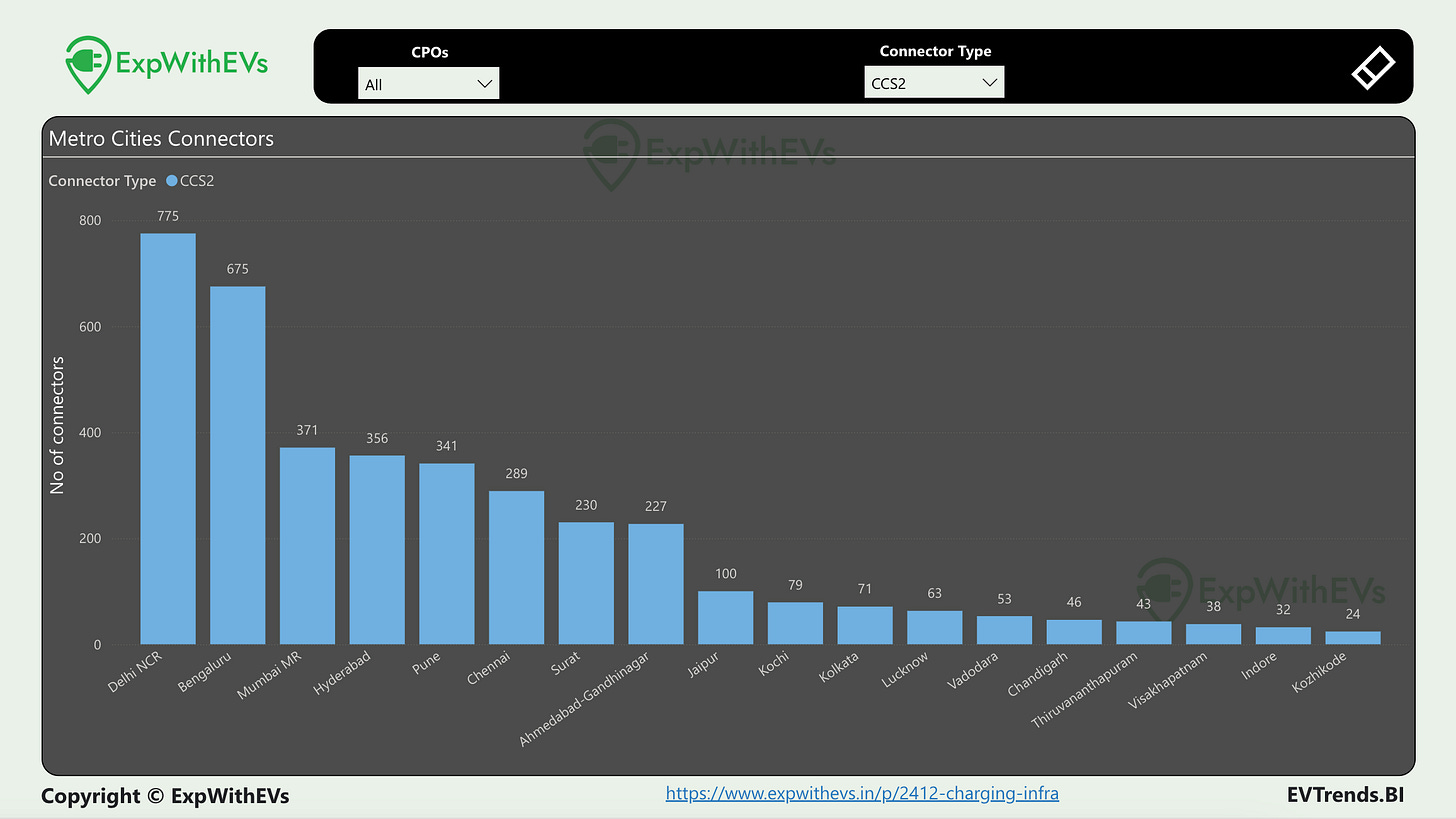
Delhi NCR and Bengaluru are the front-runners for CCS2 infrastructure among various cities in India, largely due to the presence of charging hubs. For more detailed insights on charging hubs, check out EVInfraBI.
Meanwhile, Mumbai MR, Hyderabad, Pune, and Chennai are closely clustered, with fewer than 100 charging points separating them.
You can use the above slicers in this EVTrendsBI chart to identify the distribution of charging points across these metro cities per CPO.
Before we move to Type2 infrastructure, let’s look at how many CCS2 connectors actually work.
Non working CCS2 Charging Connectors
We improved data for non working connectors by checking each CPO app three times, manually. The latest data for all CPOs was reverified in the last couple two weeks of December 2024. If you are interested to join our team to collect data, please fill this form.
Pan India CCS2
As with many other charts, IOCL leads here—but with a significant margin. During our data collection in December 2024, we found that 95.66% of CCS2 connectors on the IOCL app were not working. Yes, 95.66%.
To sum up the top three having the most non working CCS2 connectors: Government-backed Oil Marketing Companies (OMCs) that procure chargers at L1 (lowest possible rate) are responsible for the highest number of non-working CCS2 connectors. Around 70% of BPCL and HPCL's CCS2 connectors are non-operational. BPCL's chargers have been in this poor state since July 2023, as I highlighted in an article for The Ken.
On average, about 37% of CCS2 connectors across the country are non-working. If we exclude the three government-backed OMCs—IOCL, BPCL, and HPCL—the non-working rate drops to approximately 12.5%.
After filtering out IOCL, BPCL, and HPCL, the resulting chart paints a clearer picture.
Non public CCS2
The scale on the Y1 axis changes dramatically. I’m going to sort them by % non working.
KSEB (Kerala State Electricity Board), another government-backed network, has a non-working rate similar to the OMCs, at 65%. While KSEB has fewer CCS2 connectors than the larger OMCs, its performance still places it in the same category.
VoltPanda’s entire network was offline when our team manually collected data three times from their app. Volttic is also at 40% non working CCS2 connectors. Volttic has some premium real estate on Delhi Mumbai Expressway and it explains why I try to not charge there on my Mumbai Delhi road trips (Documented my 9th Mumbai Delhi trip last month). Nearly 40% of Shell’s network is non-operational.
On a more positive note, two smaller government-backed networks have relatively lower non-working rates: GMVN (Garhwal Mandal Vikas Nigam, owned by Uttarakhand's state government) on Statiq, and Evolute Surat, owned by Surat Municipal Council. GMVN’s non-working rate is around ~20%, which is acceptable, and Evolute Surat impressively has just 2% of charging points out of service.
Top 10 Private Players
The top ten private players are performing better than their public counterparts. Tata PEZC, the leader since the inception of EV charging infrastructure in India, is at 11.44%. This is not a particularly high percentage. The next largest private player, Jio-bp, ranks lowest on this list at 7.1%. Shell Recharge needs to fix its network to bring its percentage closer to that of its peers.
If you’d like to request any more such analyses, please reach out to me.
Type2 Infra
Maharashtra continues to lead in Type 2 charging infrastructure. In contrast to the CCS2 chart, Gujarat and Karnataka have swapped positions. The North Zone performs slightly better in this category, with Uttar Pradesh ranking fourth.
You can use multiple slicers in the top bar of this EVTrendsBI chart to identify a CPOs distribution of connectors across select zones in the country.
Among CPOs, IOCL has established a significant lead, with more than three times as many Type 2 connectors as the next leading players, Tata PEZC and Jio-bp.
For a detailed breakdown of 7kW, 11kW, and 22kW chargers, be sure to explore our other charger intelligence tool, EVInfraBI.
Zonal Distribution
The West Zone is leading comfortably in Type 2 infrastructure, with Maharashtra contributing more than half of the charging points. The entire North Zone surpasses Maharashtra's Type 2 connectors by approximately 7%. The Central, East, and North East Zones have seen a five-fold increase in the past year.
Now, let’s take a closer look at the CPO contributions in the top three zones.
Pan India
The top three players—IOCL, Tata PEZC, and Jio-bp—together account for approximately 50% of the public Type 2 connectors in India. EVInfraBI users would know that nearly all of Glida’s Type 2 chargers are situated in public Charging Hubs, whereas for Jio-bp, nearly one in three Type 2 chargers are located in public Charging Hubs.
West Zone
IOCL, with 25% of Type2 connectors in the West Zone, holds a significant lead over Jio-bp. Pan-India, the top three players are IOCL, Tata PEZC, and Jio-bp. However, in the West Zone, the second and third positions are swapped. Tata PEZC, Evolute Surat, goego and Bijlify are all in contention for the third spot.
South Zone
IOCL accounts for 25% of the Type 2 connectors in the South Zone. Glida and Zeon collectively contribute another 25%. Jio-bp and Tata PEZC are ranked fifth and sixth, respectively, while HPCL takes the fourth spot.
North Zone
Two players, IOCL and Tata PEZC, together account for over 50% of the public Type 2 connectors in the North region. Adding Statiq, Glida, Jio-bp, and Gentari on ChargeZone, the total coverage reaches 75%.
Metro Cities
The top six metro cities, each with over 100 public Type 2 connectors, are led by Mumbai MR, which marginally surpasses Delhi NCR. Bengaluru follows closely in third place, while Pune, another city in Maharashtra, ranks comfortably fourth. Three out of the top six cities are in the West Zone, two are in the South Zone, and the North Zone is solely represented by Delhi NCR.
Non working Type2 connectors
Pan India
Familiar names dominate the list of Type 2 non-working connectors. IOCL and HPCL take the top two spots in this non-meritorious list, with over 95% of their networks not functioning. BPCL fares slightly better, with 66% of its 15 Type 2 connectors out of service.
Additionally, all chargers by VoltPanda, much like their CCS2 network.
Top 10 Private Players
Out of 96 Type2 connectors by SunFuel, which primarily operates a Type2 network, nearly 45% are non functional. Bijlify has over 55% of its Type 2 network out of service. Zeon and goego also report more than 25% of their Type 2 network as non-functional.
EVTrendsBI
Phew, that's a lot of charts! But how do these trends compare across different states? Is the charging infrastructure struggling in some states and thriving in others?
If you’re curious to dive deeper, EVTrendsBI is the tool you need. It’s designed for easy sharing across teams, so everyone in your organization can access the data instantly.
What do you get?
You can deep dive into the trends of EV Charging Infrastructure over two years and look at the current state as of December 2024.
Get EVTrendsBI at a special launch price discount of over 25% if you purchase by 26th January 2025. Plus, Premium annual subscribers to ExpWithEVs can enjoy even greater value—lock in a lower price and get additional seats for your team!
Please fill this form if you’d like a tax invoice or a proforma invoice. All major credit cards (except AMEX) are accepted. Bank transfer options are also available. Additional seats are available to buy. Be sure to remove the extra seats if you don’t need them!
Please note, the Launch Price is valid only for Annual subscription of EVTrendsBI. It includes the next three data updates, likely once a quarter.
Premium subscriber discounted pricing is indicated by 🔒
You can get access to EVTrendsBI as a one time purchase too. This will only include the data upto December 2024. One time purchases for annual premium subscribers to ExpWithEVs is yet again at a discount with more seats for their teams!
Here’s the annual pricing after the launch period is over.
This offer is no longer valid, please refer to this for the latest update.
How can I use it?
Your organization should have an active PowerBI licence (Pro or PPU - Premium Per User). The license is also available if your organization uses Microsoft 365 E5 or Office 365 E5 products. Most corporates using Microsoft services will have access to PowerBI. Please check with your administrator.
PowerBI Pro, as a standalone product, is available at USD 10 / user / month. You have to buy the license separately and this is not available as a part of EVTrendsBI. PPU licensees can also access EVTrendsBI.
You can also sign up with a free Microsoft Fabric account. It will give you a 60 day trial for the Pro account. Once the free trial expires, the report will remain inaccessible till you upgrade to a Pro or a PPU license.
It is mandatory to have a business email address to sign up for PowerBI.
Beginners can take 30-45 minutes to understand the basics and nuances of PowerBI. We will be around to help you. PowerBI works best on Edge browsers for both MacOS and Windows. Our guidelines will help you navigate it.
Acknowledgement
Collecting charger data from multiple apps is a very time consuming and a difficult task. I would like to thank my team in helping collect the data over the last month.
If you’d like to join our growing team of data collectors, then please fill this form.
Methodology
All CPO apps were downloaded on both iPhone and Android phones. After signing up and logging in on each app, CCS2 and Type2 charging points were filtered. The data was then manually entered into a database.
The data was collected from November 2024 to December 2024. The process was done thrice per CPO. The latitude and longitude of the charging points were then used with Open Street Maps and Google Maps to get other details.
Disclaimers
The data in this tool is static but will keep getting updates every three months.
While we’ve taken great care to ensure data accuracy, we recommend verifying the information independently before making decisions. If you notice any discrepancies, please contact us at priyans@expwithevs.in.
Disclosures
[2023] - I had conducted a 3rd party audit of Glida's charging network and was paid for it.
[2023] - Charge Mod, EVOK, TataEV, Ador Digatron have paid for my travel to attend their events.
Caveats
~10% of Type2 in 2402 were private.
All private / restricted / limited access / captive chargers have been consciously removed from 2409.
This piece can be re-published (CC BY-NC-SA) with a line mentioning ‘This was originally published on ExpWithEVs.in’ and a link back to this page. In case of re-publishing, please alert priyans@expwithevs.in
I am grateful to Garvit Singh and our data collection team of volunteers to make this possible.


