2402 - Charging Infra [FREE]
State of EV charging in India - 4th edition - February 2024
Edit : Jul 2025 : If you are looking for the latest edition of EV Charging Infrastructure Reports, then please follow these links :
ExpWithEVs Products and Services
Housekeeping
This is the fourth edition of the report on the state of Indian EV Charging infrastructure. This report contains 18 charts and 4 maps depicting CCS2 and Type2 chargers from 68 CPOs. Here’s the list of reports.
All the data from the previous reports are publicly available in the embedded links.
This report will have two versions - one free, one paid. You’re currently reading the free version. It has charging points from 68 CPOs, total charging points in the country, total not working charging points CPO wise and the trends in zonal distribution.
The paid version of this report will drill down further and include :
CPO wise charging points in states and top 10 cities in India.
Not working charging points across CPOs, geographies.
Underpenetrated states in terms of charging infrastructure
A glimpse EV charging infrastructure utilization in states
Maps and charts
The report has been compiled through publicly available data sources from late Jan to mid Feb 2024. Please find the details about the paid report at the end of the post.
The data from the free version of this report is also available in public domain.
Acknowledgement
97 CPO apps were analyzed for this report however data from only 68 apps is being represented here. Lucky Agarwal, a young BBA student, helped with data collection. He is looking for internship opportunities. Please reach out to him on his LinkedIn with opportunities.
I’d like to thank Siddharth Agarwal for the maps that you see. Lastly, I would also like to thank the CPOs for sharing the data with me.
Appeal
You can support me by scheduling an air quality test by ActiveBuildings for your home or office for as low as INR 699/-. This is available in every major metro city in India. Do you feel better when you step out of the office for a walk / smoke? If yes, then you need to get your air tested ASAP. You should know why testing your air quality is important.
Disclosure - I am the cofounder of ActiveBuildings.
Also, subscribe, if you haven’t already.
Disclaimers and disclosures
While significant effort has gone into ensuring that the data in this report is as accurate as possible, please do your own research before making any decisions. Incase of any irregularities, please write to me at priyansevs@gmail.com.
The data was collected via the concerned CPO apps from Jan 27 to Feb 10 2024 across the day. Some apps have been excluded because it was really difficult to collate their data the way we wanted. With limited resources, this is what we were able to produce.
I had also conducted a 3rd party audit of Glida’s charging network and was paid for it.
Let’s dig in
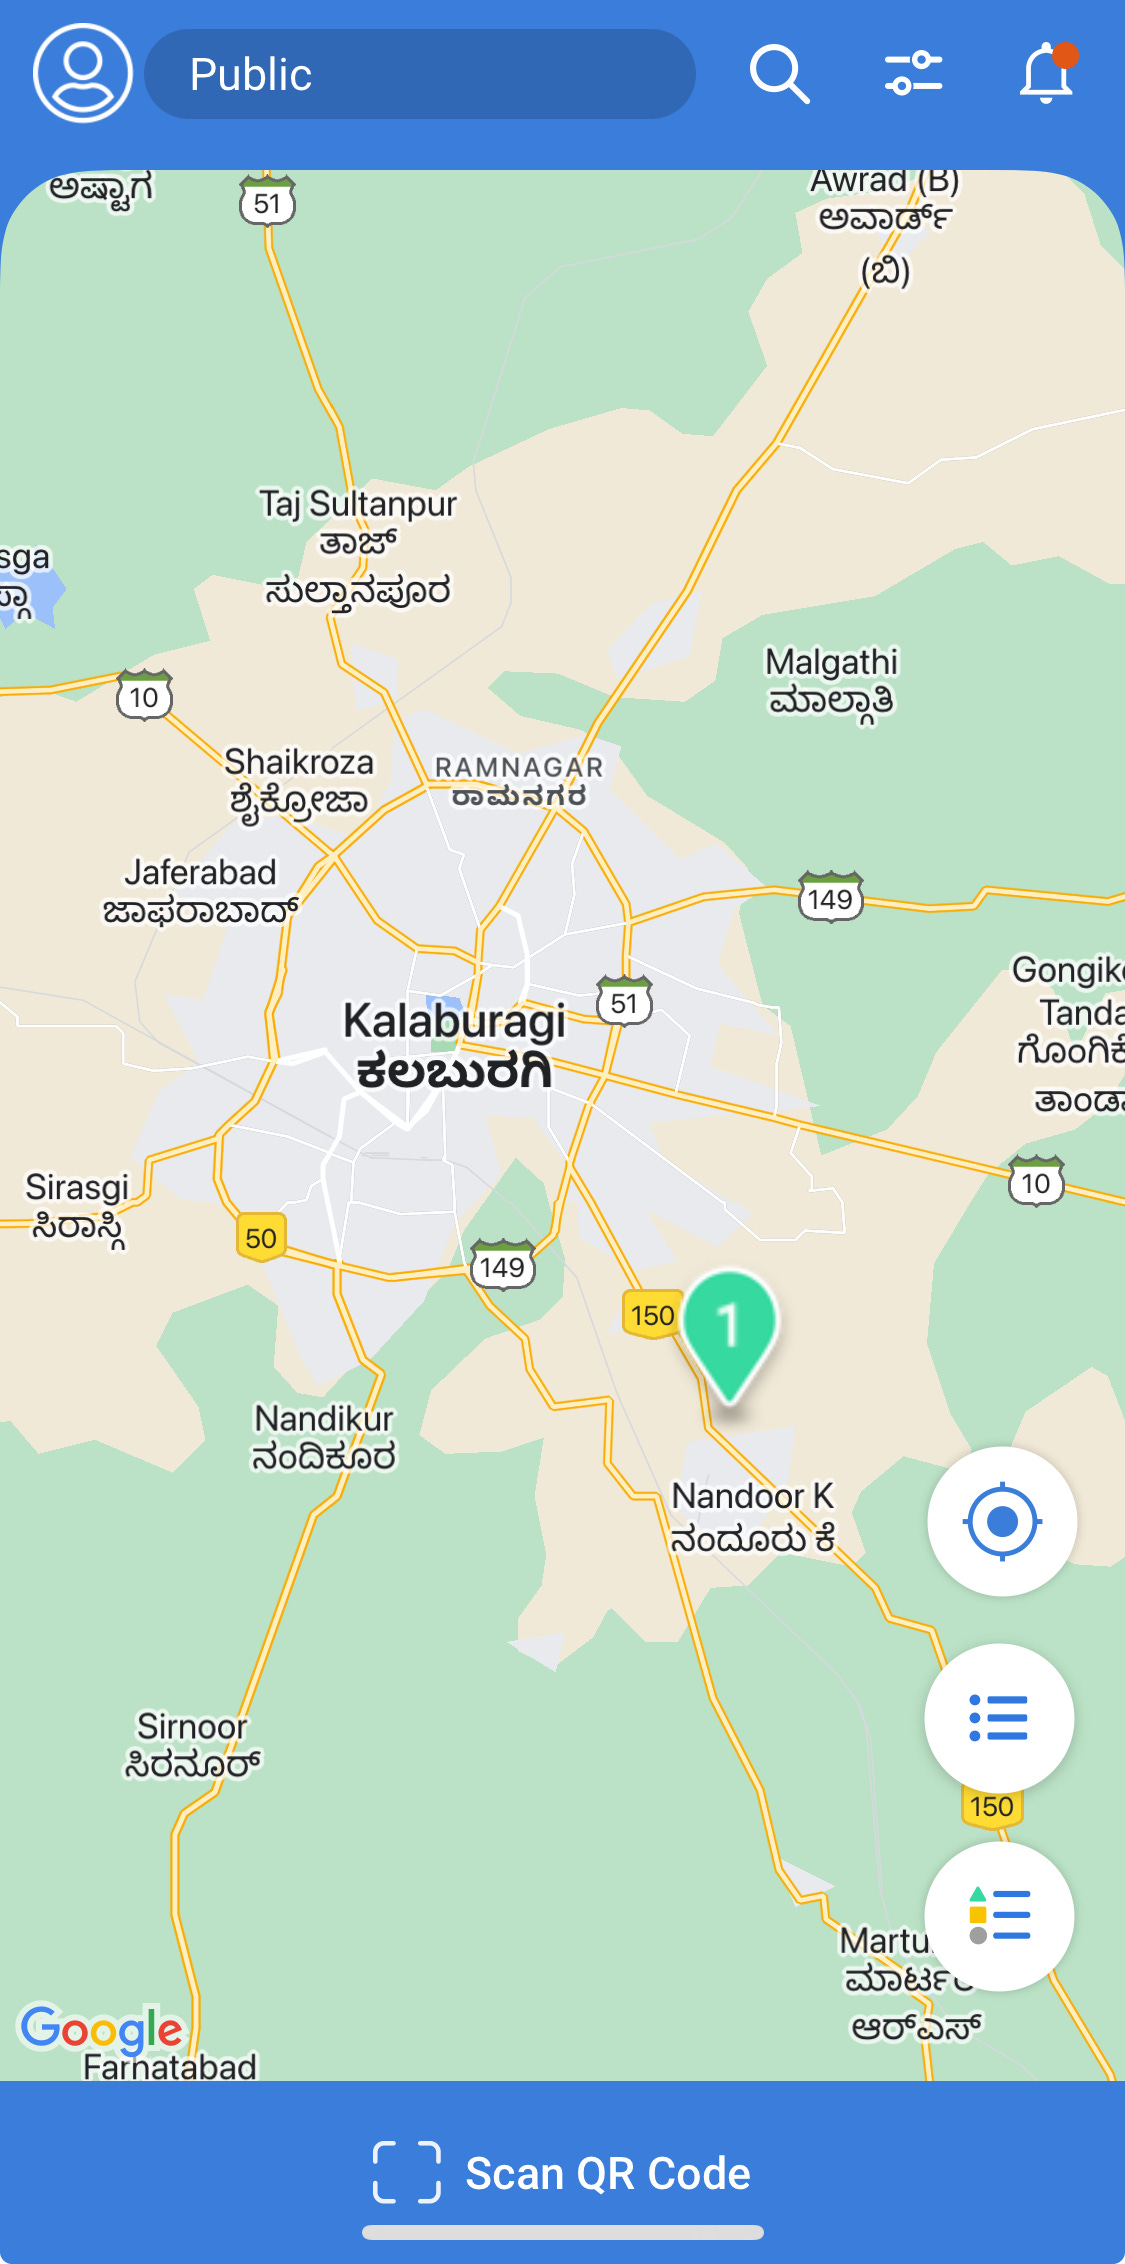
My first EV roadtrip was in early May 2022. Kalaburagi, the largest city in north Karnataka, didn’t have a fast charger then and I relied on a generous doctor to charge my car with his slow charger. I am happy to report that there’s now a fast charger in Kalaburagi, and it took only ~22 months to get there! The public charging infrastructure in India is reaching deeper into the country.
CCS2 Infra
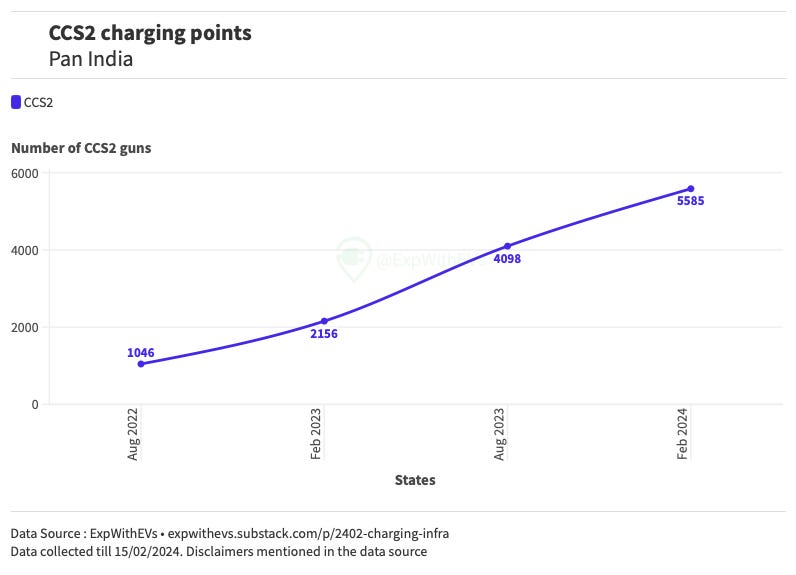
The public CCS2 charging infrastructure has grown 2.6 times in the last one year. India now boasts of 5585 charging points*.
The CCS2 charging points have grown in states like Haryana, Rajasthan, Gujarat, Maharashtra, Karnataka, Telangana, Andhra Pradesh, Kerala and Tamil Nadu.
The circles have grown smaller because it was too difficult to fit them in the map as per the previous scale. Now smaller circles are representing a much higher number of chargers. We also had to increase the cutoff (to be visualised on our map) from 10 DC Charging Points in a particular state to 15 and then 20 points over a period of just one year.
Today there are 23 unique CPOs with atleast 20 charging guns in a state / union territory (UT). 6 months ago, there were 21 CPOs with a lower cutoff of atleast 15 charging guns in a state / UT.
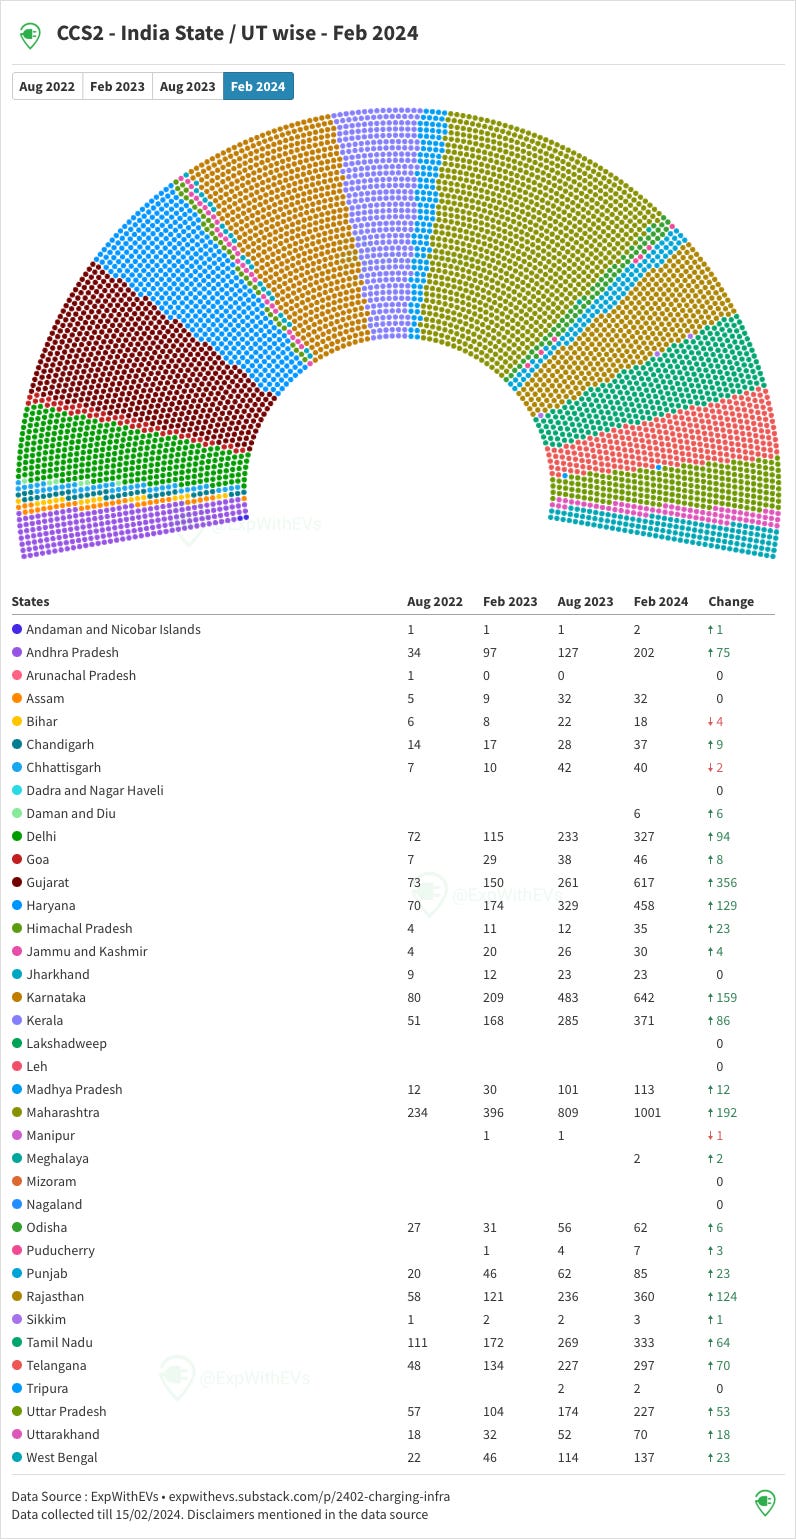
The leader is Maharashtra, followed by Karnataka*, Gujarat, Haryana, Kerala and Rajasthan.
Here’s the statewise distribution* of chargers over 4 editions of this report.
Tamil Nadu has fallen from 4th to 7th in a year, whereas Gujarat jumped three places to number 3 since the last count. Tamil Nadu has a strong regional player like Zeon and high charging tariffs. Those could be some of the reasons why the growth has not kept up with other states. Rajasthan has been gradually climbing and is now at number 6.
Gujarat’s jump can be attributed to Evolute Surat. Single handedly, this CPO has increased the count of CCS2 charging points by over 200. The CPO’s user interface is similar to that of ChargeZone. The app is owned by Surat Municipal Corporation. Gujarat also had the highest number of CCS2 additions in the last 6 months at ~350 charging points. The top 5 CCS2 states added over 100 CCS2 charging points in the last 6 months.
Himachal Pradesh had the highest relative increase of CCS2 charging points, close to 200%, followed by Gujarat at ~140%. 13 states with a minimum of 100 charging points as of Sept 2023 grew at an average rate of 40%.
There are ~27 cars per CCS2 charging point in India. This data doesn’t include the car registrations from Lakshadweep. The data for EV registrations was collected from Vahan Portal for the rest of the states except Telangana and Lakshadweep. Telangana data was generously provided by EVReporter.
Unlock more insights about state per CPO trends and which states desperately need to grow the CCS2 and Type2 charging infra, consider buying the paid report. Details at the end.
Zonal Distribution
The West Zone overtook the South Zone* for total number of CCS2 charging points from the previous report. The West Zone also added the most number of charging points ~750. The East Zone saw the fastest relative growth at close to 70% since the previous report.
North East has the growth of 4X in a year. Helps when starting with a lower base. West grew almost 3X in a year, North and South* at ~2.5X.
East and Central India are lagging behind the West, North and South* by over 18 months.
West Zone
West Zone has 44 CPOs, up from 33 from the previous report. Tata, Jio BPPC, Evolute Surat and ChargeZone have more than 50% charging points in this zone. Tata’s share has shrunk to less than 25% from 45% over a year ago.
Six months ago, BPCL and Jio BPPC displaced ChargeZone and Statiq from the second and third place. Of them, only Jio BPPC has managed to improve their ranking and hold on to the second spot firmly. The new CPO Evolute Surat has become the third biggest CPO.
BPCL has dropped down to 5th position. In July 2023, I wrote about how over 60% of their charging infrastructure was not working. Since then, BPCL has managed to reduce their non-working charging points (available in the paid edition) and reduced the number of chargers visible on their app by ~9%.
Statiq, ranked third over a year ago, has now dropped down to 8th position, despite increasing their strength by close to 25%.
West Zone has 5 companies with more than 100 charging points and 3 companies with 50 - 100 charging points. There are a lot of smaller players in the West Zone as compared to other zones.
North Zone
34 CPOs have a presence in the North Zone, up from 26 in the past. Tata and Jio BPPC have maintained close to 50% of the chargers in this zone for the last few months. BPCL fell from 3rd spot to 5th. Statiq and Glida have climbed up a rank each.
North Zone has 5 companies with more than 100 charging points and 1 company with 50 - 100 charging points.
South Zone*
48 CPOs have a presence in the South Zone, 15 more than before. Previously, Tata, BPCL and Jio had ~50% of the charging points. ChargeMod, a very strong regional player in Kerala, has replaced BPCL and taken the third spot. BPCL has gone to 6th spot with a decline of approximately 50% charging points. South Zone has 6 companies with more than 100 charging points and 4 companies with 50 - 100 charging points.
Pan India*
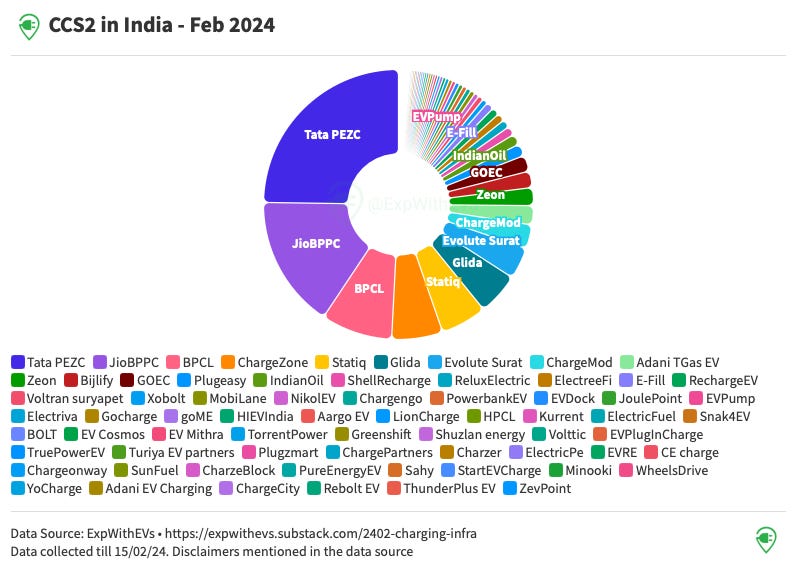
The top 6 CPOs in the previous report and now are the same, with one change. Jio BPPC swapped places with BPCL, with Jio BPPC now placed as the second biggest charge point operator in India. 13 CPOs have more than 100 charging points, up from 6 half a year ago. The total number of CPOs have increased to 68 from 50, since the last report.
Offshoots from big businesses / governmental bodies - Tata PEZC, JioBPPC, BPCL, Glida, Evolute Surat, Adani TGas EV, Shell Recharge, BHEL EV.
Startups that have raised capital - ChargeZone, Statiq, ChargeMod
ChargeZone and Statiq are poised to leapfrog BPCL in the next few months. It will take a lot of capital to dethrone market leaders like Tata and Jio BPPC.
Faulty Chargers
How do the top 10 players stack in this regard?
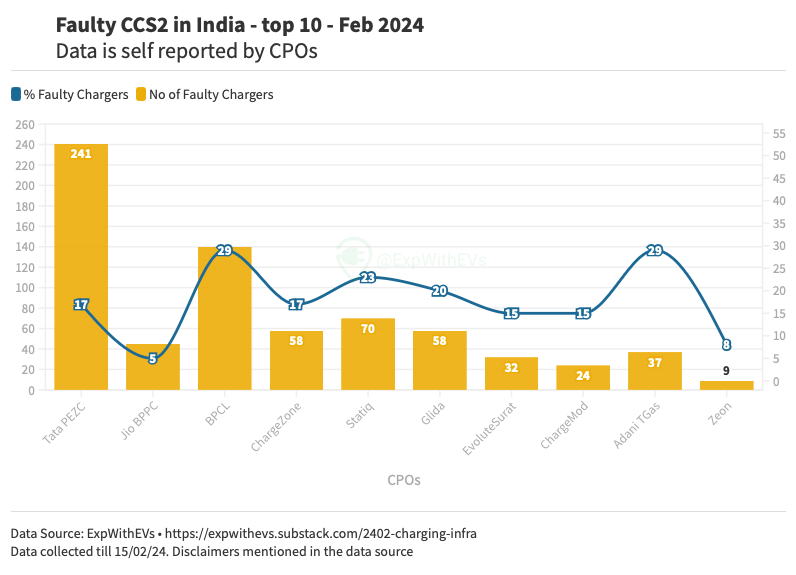
On an average, seventeen percent of the charging points in India are faulty. Of the top 10 players, only 4 of them have a lower fault % than the national average. Kudos to BPCL for bringing down the faulty chargers by more than half from less than a year ago. ChargeMod and Jio BPPC too have reduced their faulty charging points on the app.
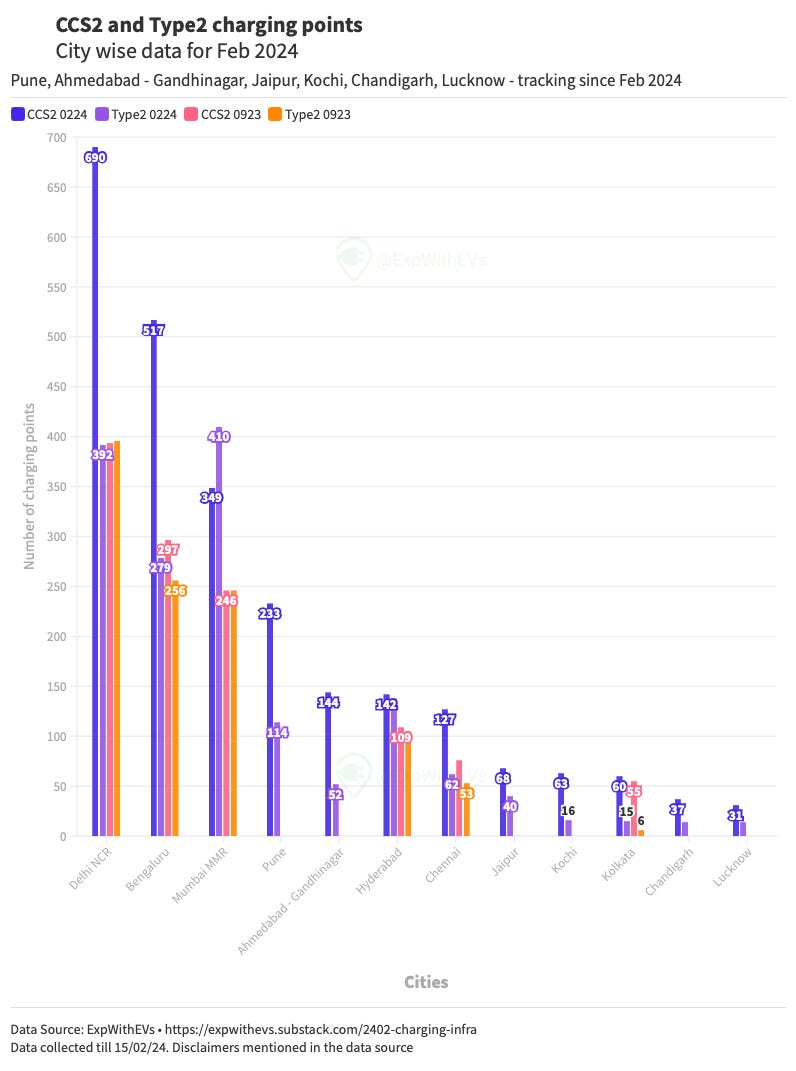
Metro Cities*
The charging infrastructure has grown tremendously in all major cities. Delhi NCR, Bengaluru* and Mumbai continue to maintain their leads across the last 6 months.
You can find the extended analysis of faulty charging points in the paid version of this report.
Type2
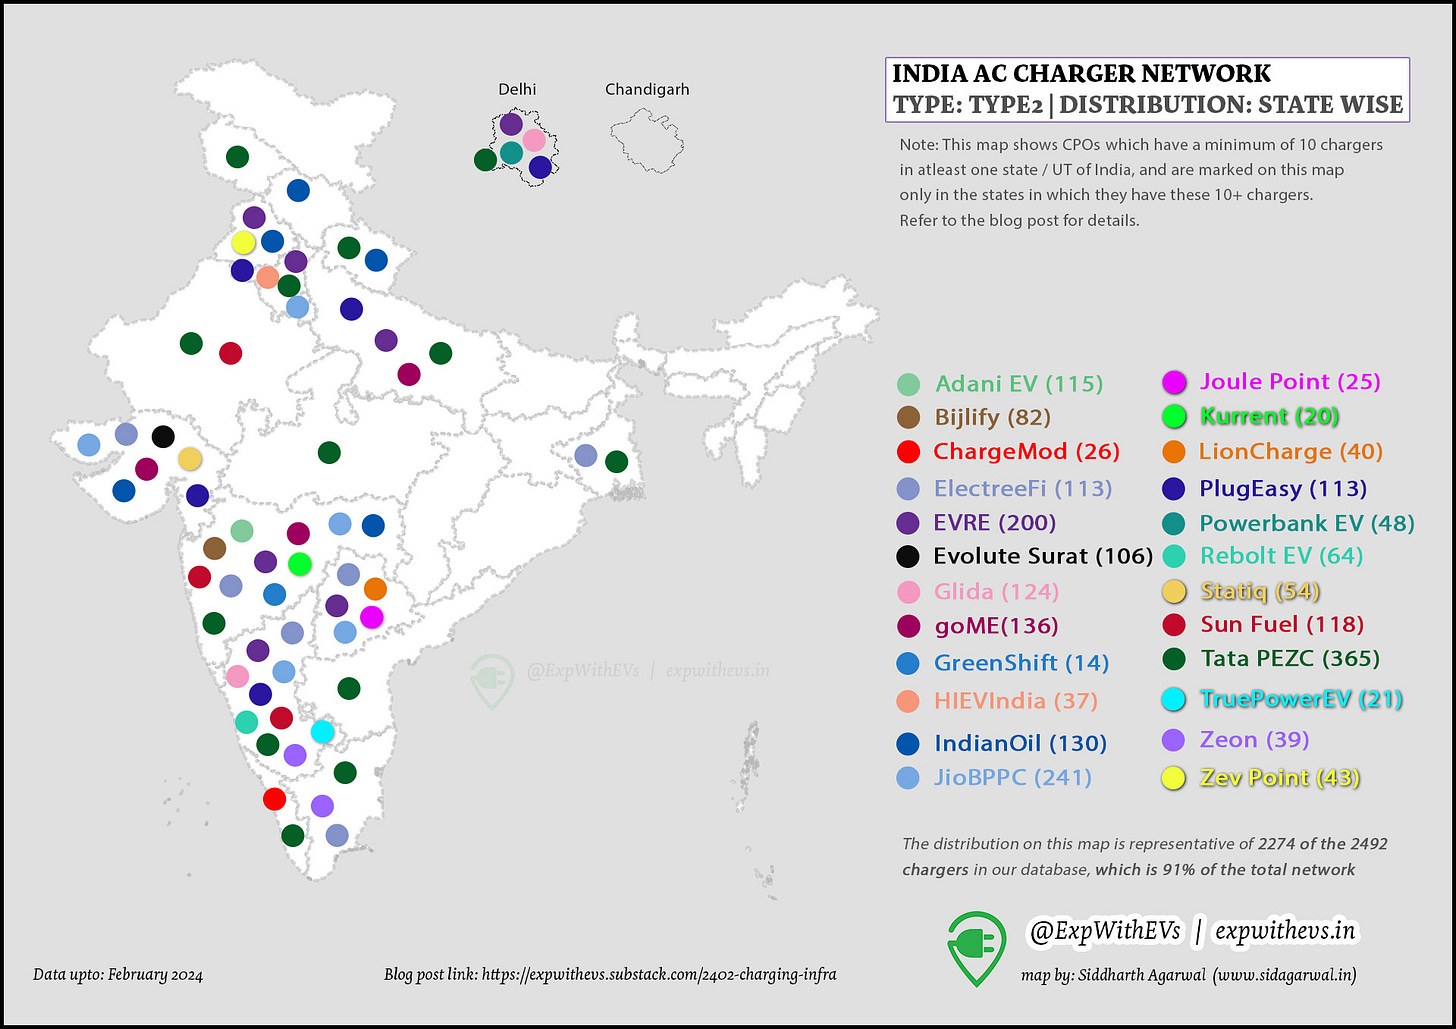
There are atleast 24 CPOs having more than 10 Type2 chargers in a state / union territory, up by 2 from our previous report. This shows that more CPOs are aggressive in expanding their Type2 infrastructure.
This gif shows the growth in infra.

From the 6th spot, Gujarat climbed to the 3rd spot, similar to the CCS2 list. Maharashtra and Karnataka held on to their ranks of 1st and 2nd respectively. Delhi pipped Haryana, and Telangana pipped Uttar Pradesh to improve their spots this time around.
Tata has taken over the throne here, yet again. It is followed by Jio BPPC, up from 4th just 6 months ago. goME and Statiq have moved down a few spots this time around.
The top 7 players have more than 50% of the Type2 charging points in the country.
There are atleast 55 CPOs with a Type2 charging network now, as compared to 42, from the last report.
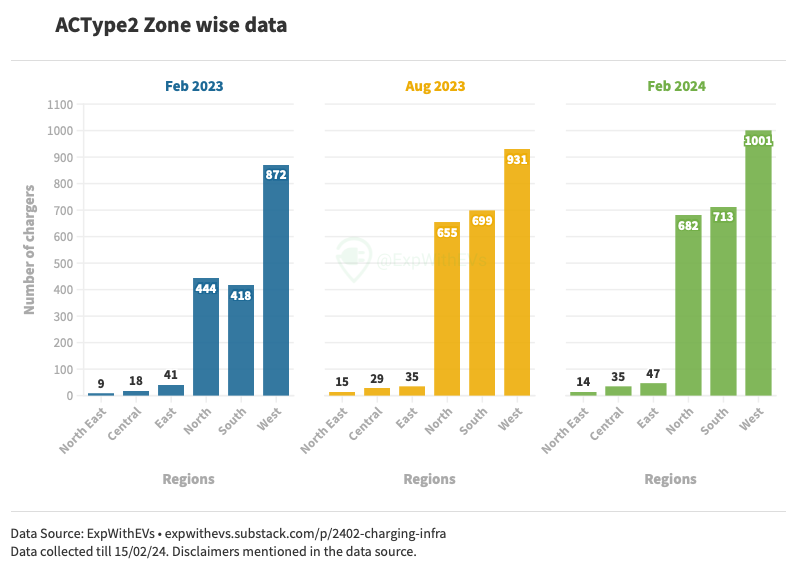
Type2 Zonal
The West, South and North continue to dominate, in that order.
4 CPOs cumulatively have more than 50% of the Type2 charging points in this zone. JioBPPC was closely fighting with Statiq a few months back for the third spot, and is now a leader in this zone.
I am unable to point out the exact reason why goME slipped from being the leader to its current 5th spot. 35 CPOs have a presence in this region, up from 25 in the previous report.
The top 6 CPOs have more than 50% of the Type2 AC guns. Up from 5, at the time of the last report. The leader of the pack remains the same, i.e. Glida. Statiq has gone from 2nd to 15th spot. I am unable to explain how. EVRE has moved from 7th to 2nd. Tata has slipped one spot from 3rd to 4th. Rebolt EV is a new entrant in this list and has claimed the third spot.
Zeon, PlugEasy, LionCharge, JioBPPC, ChargeMod are neck and neck. South Zone now has 42 CPOs, up from 26 from the previous report.
Tata PEZC is still leading in the North Zone. goME’s second spot is now held by EVRE. The third place is held by Indian Oil, which is a new entrant in our list. goME, Aargo EV, Glida, SunFuel, HIEVIndia, Jio BPPC and ZevPoint are all pretty close to each other.
North Zone has atleast 30 CPOs in the Type2 market, up from 24 in the previous report.
Real world costs of fast and slow charging
I wanted to end this report by showing how much I have spent on both fast and slow charging. I own MG ZS EV 2022 and Tata Tiago EV. Cumulatively, they’ve done 52,000 kms, with close to 45,000 kms on the MG. Tiago EV is my city car with almost no fast charging. MG ZS EV has clocked around 22,000 kms on cross country trips in India.
Please note, this includes the slow charging at malls, resorts, hotels, friends’ houses with little to no cost.
This real world data has been collected since May 2022 and shows that home charging is the most economical option. Also shows that despite many road trips, home and slow charging units are more than 2x the fast charging units.
Total running costs of driving two EVs cumulatively 52000 kms is approximately INR 1.71/km with an efficiency of 144 wh/km or 6.9 km/kWh.
You can also deep dive into each charging session and the details on this google sheet - sheet 1 and sheet 2. Data includes how much time was spent at the charging location, how many units were consumed and the money spent per CPO.
Paid Report
Thank you for reading the post this far. The paid version of this report will be released sometime mid to late March 2024 via email. Please consider buying the paid report if this report has been of any help to you. The paid version of this report will deepdive on the same dataset, thus disclosures mentioned earlier will still apply. The report will contain :
CPO numbers state and UT wise
Non working charging points for the CPOs
Total non working charging points per state per CPO
Total non working charging points per metro city per CPO
Analysis of CPOs - state strengths and weaknesses
States that I believe can have better charging infrastructure and are lacking it right now
A glimpse EV charging infrastructure utilization across various states
More maps and charts
<edit : 03/04/2024 - removed bank account details>
On successful payment, please drop an email with the screenshot of the payment. The report will be shared on that particular email address only. Proforma Invoices and Tax Invoices can be shared upon request.
The contents of this paid report are only for the companies / individuals who have paid for it. Data or charts cannot be shared on any public platform without prior written approval. Please drop a line on priyansevs@gmail.com with your details.
Psst, if you purchase this report, you’ll get a special discount for the next industry report, which is due to be published in the next few months.
Conclusion
The charging infrastructure is growing. New players have shown that they can enter the fray and still get noticed. The top triopoly of Tata PEZC, Jio BPPC and BPCL is still with them. The reliability of the infrastructure will also increase once some major players improve the working / not working ratio.
Certain states really lag behind in the charging infrastructure. I would recommend every new charge point operator to go deeper into a state and then branch out to other states. This helps with local charger OEM support as well as getting a loyal crowd of electric vehicle owners as customers. Since electricity is a state subject, it becomes easier for the CPOs to deal with the same bureaucracy repeatedly.
*Errata : 10-03-2024 : The total number of CCS2 charging points for Shell Recharge is 114. Previously, the article had mentioned 60 CCS2 points. All the 54 charging points that were missed are in Bengaluru, Karnataka. Accordingly the updated CCS2 charging points in Karnataka are 696. The updated CCS2 charging points in India are 5639. The error is regretted.
This piece can be re-published (CC BY-NC-SA) with a line mentioning ‘This was originally published on ExpWithEVs.in’ and a link back to this page. In case of re-publishing, please alert priyansevs@gmail.com
Text, charts and analysis - Priyans Murarka
Data collection - Priyans Murarka, Lucky Agarwal
Editing, maps and gifs - Siddharth Agarwal










The report and data provided offers good insights. I am happy to see such good quality reports.
keep up the good work .
Very insightful analysis, would you have city wise list of network spread ? and also uptime analysis city wise ?